What $200 gets you on Twitter, Facebook, and Instagram
TL;DR We spent $200 advertising the Dropmark iOS launch on each major social network and all we got were these stats.
When we launched Dropmark for iOS, we wanted to get it onto as many Apple devices as possible. We had explored social media advertising in the past, but we wanted to run a more scientific experiment this time around. Consider this blog post our report.
Hypothesis being tested
The money spent would proportionally increase Dropmark’s visibility in people’s timelines and generate interaction we wouldn’t see organically.
Materials
-
Twitter
-
Instagram
-
Facebook
-
Promotional video
-
$600
-
Thumbs
Procedure
At the time of placing these ads our reach was:
![]()
We had not previously used Facebook that much, but earlier in 2017 we obtained the right to Dropmark’s Facebook page from a DJ in Argentina (but that’s a story for another time).
We spent $200 on promotions on both Twitter and Instagram on September 19 and a further $200 on Facebook on September 22. You can see the adverts on Twitter, Instagram, and Facebook.
Observations & Analysis
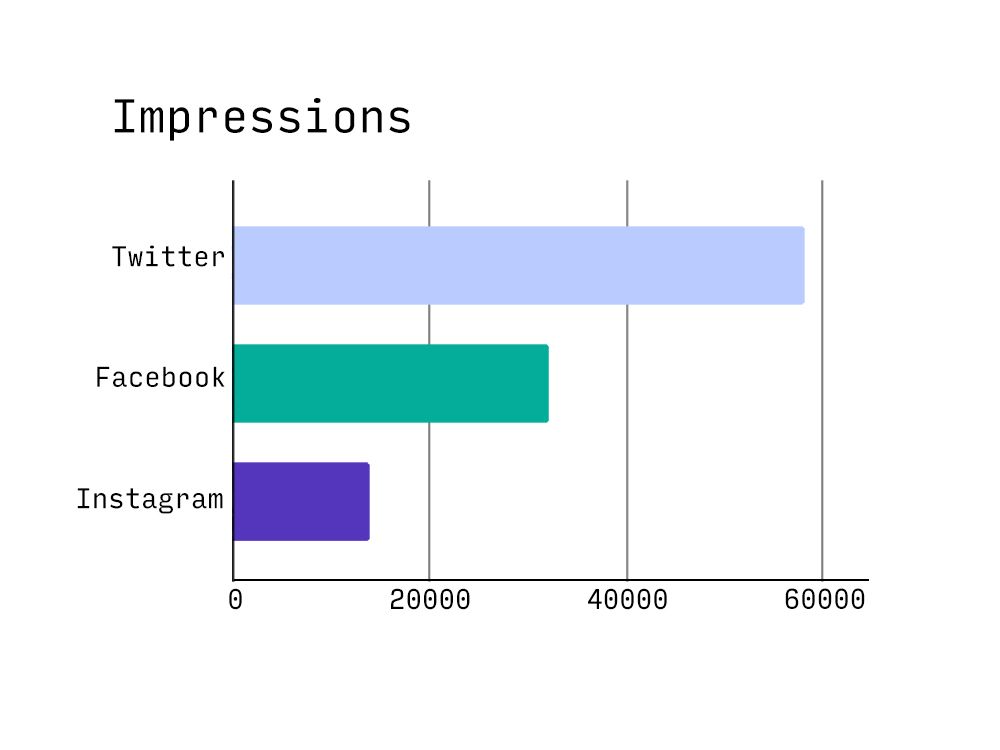
Twitter got the advert out widest, reaching more than three times as many people as Instagram.
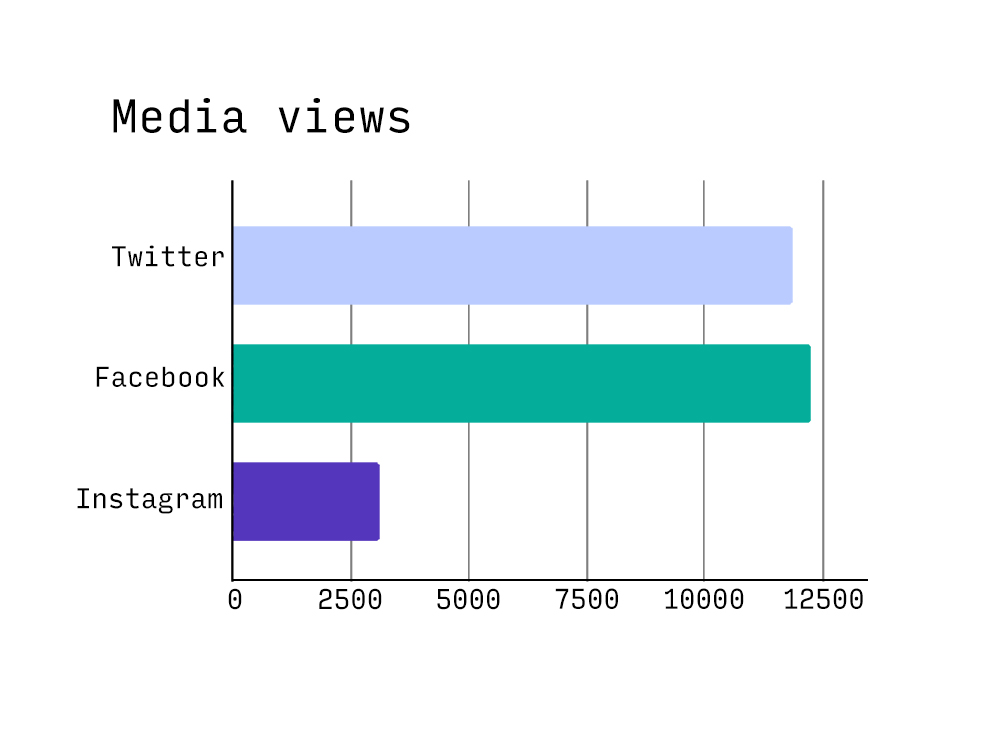
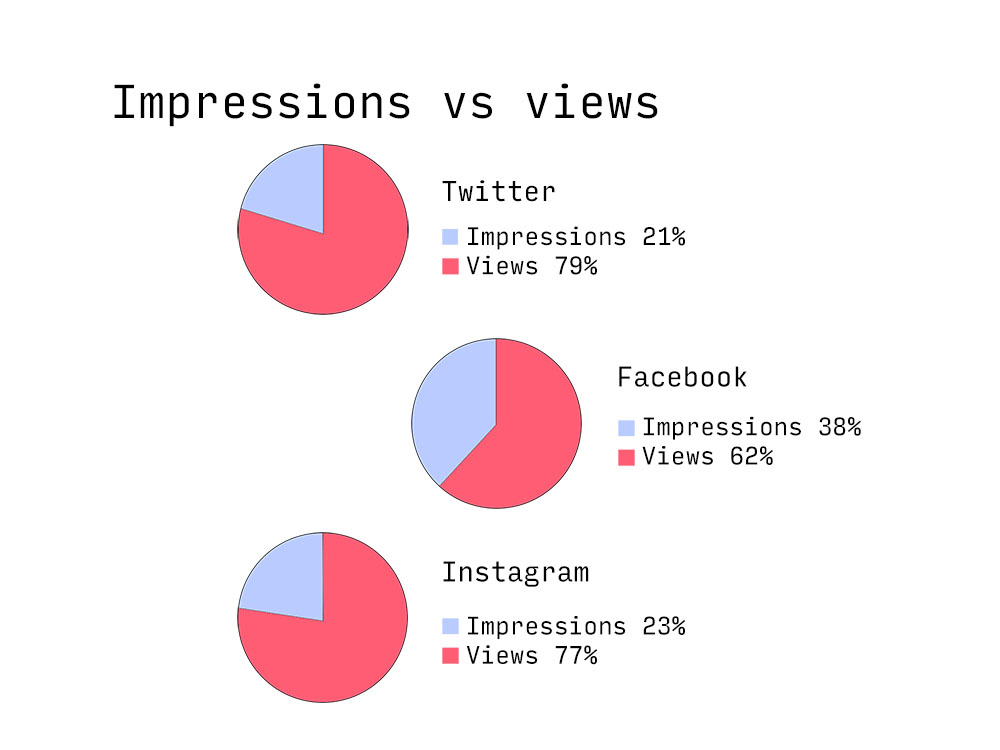
Although Twitter got the advert out the widest, only 20% users interacted with the video. The rates of impressions versus media views below shows Facebook surprisingly pulling ahead with interactions.
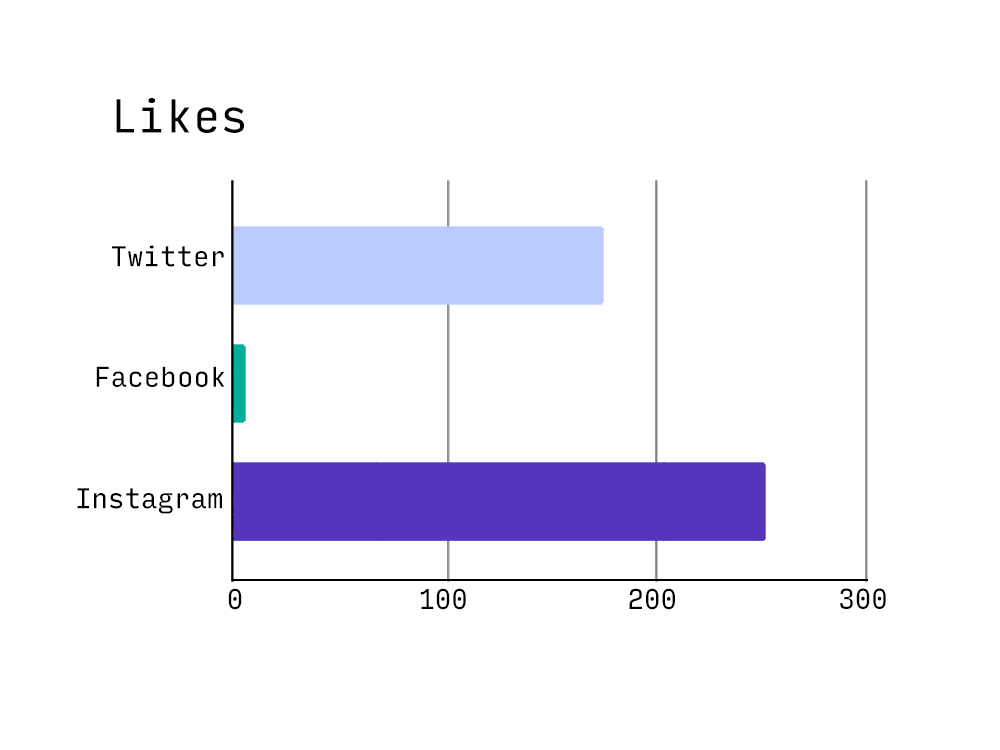
Instagram likes outperform the others, which is common for the platform. I typically like anywhere from 20-50 images on Instagram every day, in contrast, I probably favorite 1-2 tweets a day, because a tweet has to be particularly amusing for me to favorite it. Like every single tweet that Oscar the Grouch has ever written.
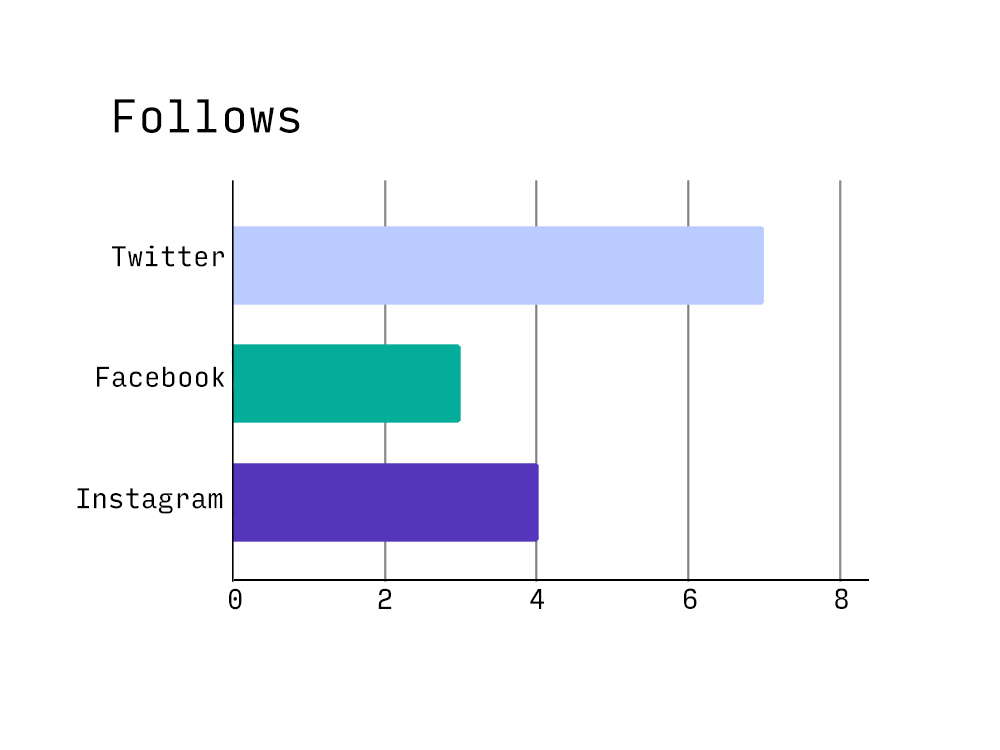
We designed this promotion for link clicks, and as you can see, we didn’t get a whole lot of new followers from these promoted adverts. 14 followers for $600 would be probably the most expensive followers in the world at $42.85 per user. There are links online where you can buy followers 500 for only $5, so if you want to go the shady way, it’s a lot cheaper, although potentially damaging to your brand.
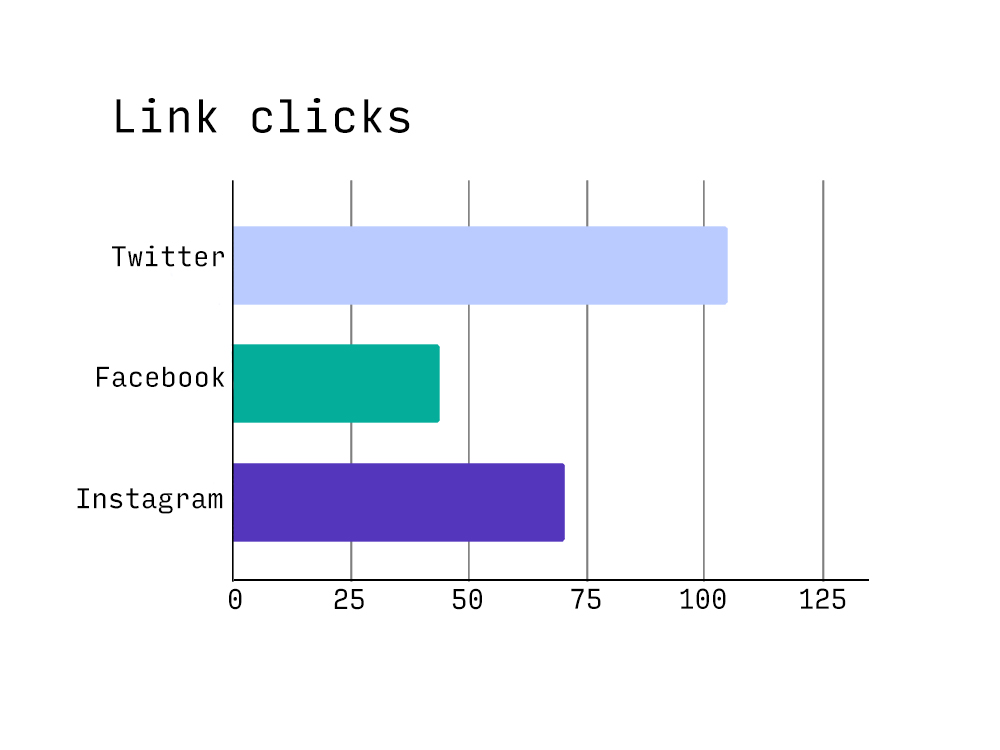
As you can see Twitter had the most link clicks, which isn’t unexpected because clicking on external links is a more integral part of the platform, unlike Instagram which isn’t as good at directing users to external web pages.
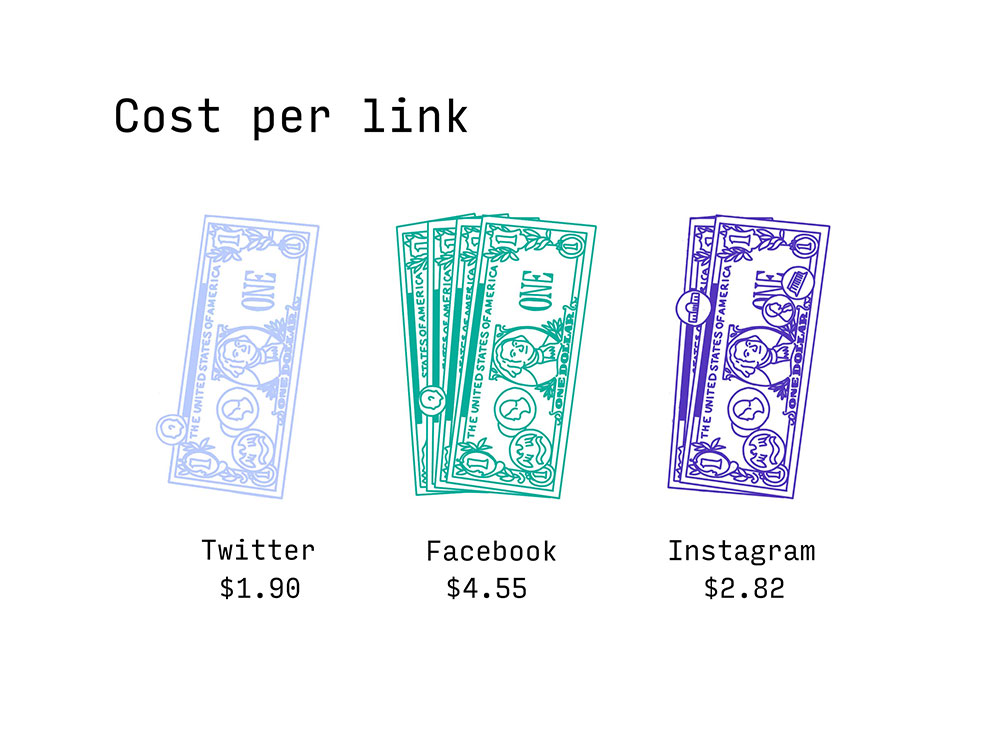
Interestingly when we view the link clicks by their cost, it shows that the clicks that came from Facebook cost us twice as much than the ones that came from Twitter. Perhaps this is because Facebook isn’t a cornerstone of our digital marketing like Twitter and increasingly Instagram.
Or, it could be as my teenage brother tells me: only ‘old’ people are on Facebook.
Analytics
Looking at our Google Analytics for the week beginning 18 September when we launched Dropmark for iOS 1.2% of our traffic came from Twitter, 1.6% from Facebook, and 0.2% from Instagram. Amazingly 0.8% came from Tumblr, and we don’t even have a presence on Tumblr.
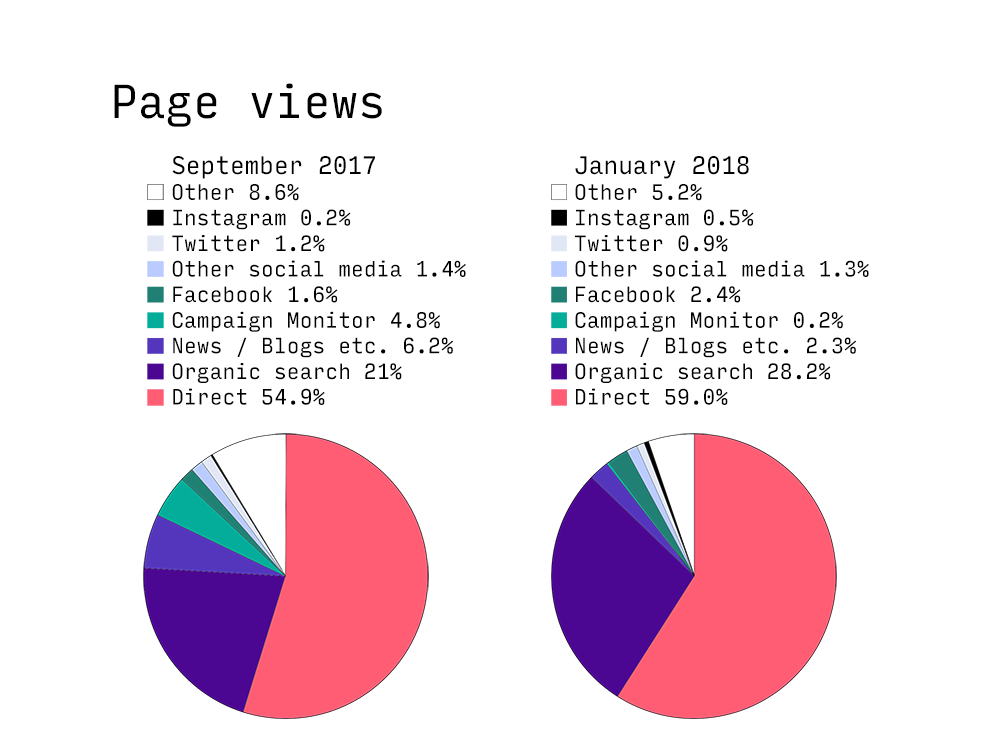
If you compare September, when we ran the adds, with Dropmark’s traffic last week when there was no promotion you can see:
-
More people are coming Directly to Dropmark and through organic searches, probably because there is a broader user base than in September.
-
Far fewer visitors came from news, blogs, or inspiration sites in January. We were lucky to get a fantastic amount of coverage for the iOS launch and can’t expect that every week.
-
There are also fewer visitors from Campaign Monitor because we haven’t done a Dropmark newsletter this year.
-
Facebook referrals are up, despite our page only getting a handful more likes. Hopefully, this is because people are chatting with friends and directing people our way.
-
Twitter referrals are down because we’ve run no adverts, but Instagram is up - probably because we’ve been growing our followers there and have over twice as many followers now as we did in September.
What did we learn?
In the future we’re going to steer clear of Facebook adverts, they cost a lot of money per click, and the conversion of followers for long-term engagement is low. For us, Twitter & Instagram are our most active platforms anyway, so it makes sense to prioritize these platforms.
The adverts were useful for us at a time that we wanted to generate buzz around the iOS launch, and it made Dropmark for iOS more visible. But it’s important to remember that spending money on social media doesn’t always pay off.
After reading all that, you should follow Dropmark on Twitter, Instagram & perhaps even Facebook.